The same numbers your statistician trusts
The modules were carried over from their tool one to one and are guarded by tests that compare the result cell by cell — quirks of the old program included. Changing the tool does not change the numbers.
From the court to the conclusion.
You record the game possession by possession, the stats compute themselves, the report says what happened, and the system points at specific training drills — on your data, on your server.
Nothing has to be retyped between stages. What the person at the scorer's table writes down reaches the training recommendation.
Possession by possession: action code, shot zone, time, the five on court, the player finishing it. From a phone or a laptop at the table, with nothing to install.
Thirteen 5×5 and 3×3 modules — the same tables your statistician has been building by hand, matching their sheet cell by cell.
Wins against losses, the rhythm of the quarters, runs, shot zones, the on-court balance of each five, a player's trend across the season. With a warning when the sample is too small for a conclusion.
Twelve rules ask your data about specific weaknesses and point at drills from the coaching literature. Every recommendation shows the numbers it was built on.
Screenshots from a running instance, on real games from professional competitions — not mockups. Pick an item from the list or wait for it to advance on its own.
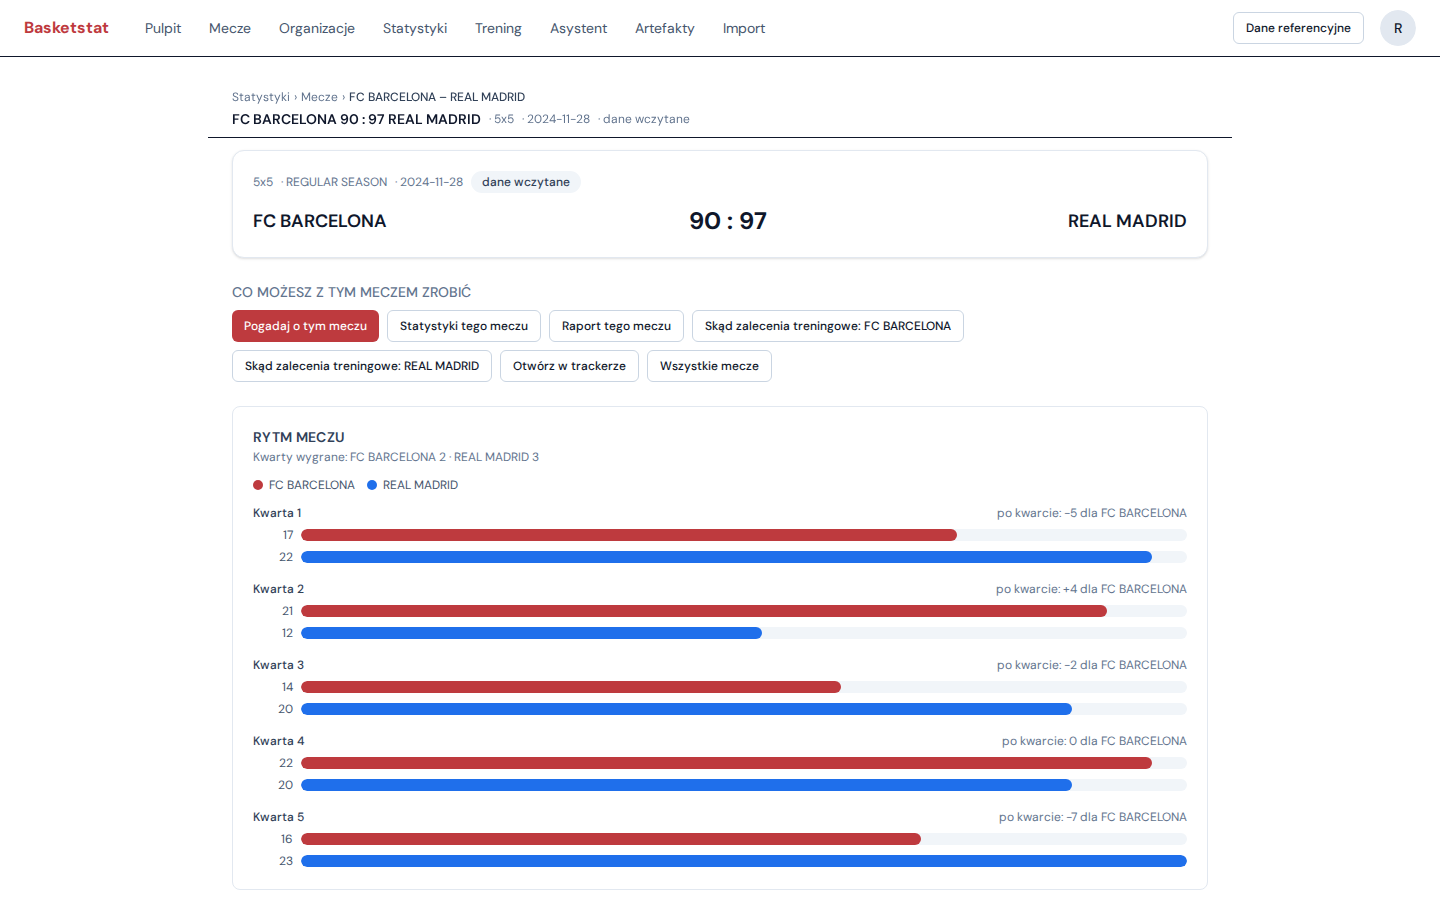
Six things that together close the path from recording a game to deciding on a training session.
The modules were carried over from their tool one to one and are guarded by tests that compare the result cell by cell — quirks of the old program included. Changing the tool does not change the numbers.
A comparison of any two sets of games, the rhythm of the quarters, runs, a map of shot zones, the on-court balance of each five. Ready to print and to send.
You record a focus for a player, and after a few games the system checks by itself whether it improved. Plus a catalogue of drills matched to what the data shows.
Every verdict comes with a confidence interval. When the sample is too small you get “check this”, not an invented diagnosis. The audit screen shows every rule — including the ones that stayed silent.
The assistant in the app answers questions about your games and shows which data it used. Every number in the answer comes from the database — tests make sure the model does not invent one.
The platform runs on your own infrastructure and the club's data stays in the club. Each organization sees only its own games.
The same platform answers different questions for a coach, a statistician and a board. Pick yours.
From the game to the training decision, without a spreadsheet.
See the details →
Your modules cell by cell, sheet import and export, a file validator.
See the details →
One platform for every team, data on your server, a trace of every change.
See the details →
Your real contribution and your trend across the season, not just points.
See the details →
A readable summary of the game and a way to ask about it in plain language.
See the details →
How your club and its rival play, on data rather than impressions.
See the details →
So there are no surprises at the second meeting.